
What two pilot cohorts measured.
Both sets of numbers below were measured by the districts themselves, on the assessment they already run, and every figure is shown with the instrument it came from.
No students started the year on grade level. Two-thirds finished there.
On the i-Ready Math Diagnostic, pilot classrooms moved from 0% of students on or above grade level in the fall to 67% in the spring. Comparison classrooms moved from 17% to 25%. That is a 67-point gain against an 8-point gain, from a starting point further back.
% of students on / above grade level · i-Ready Math Diagnostic
The same pattern held where the starting data was harder.
Over half of 7th graders in pilot classrooms reached proficiency, against 4% in non-pilot rooms in the same school. In 8th grade, pilot classrooms went from zero to 29% proficient - in a building where no non-pilot 8th grader tested proficient at all.
School-wide, students in the program made a median of 157% of typical annual growth, and 69% improved their placement level.
% proficient by grade · Phillips Middle · i-Ready · Edgecombe County, NC · 2024–2025
How to read these numbers.
Both sets are pilot cohorts, measured by the districts themselves on assessments they already run. Neither is a controlled trial. Neither is a projection for your schools.
We publish them because they are the strongest evidence we have that changing teachers' mathematics changes what students can do - not because we are promising you the same figures. If anyone selling professional development quotes you a growth percentage for your district, ask them what it is measured on and who is standing behind it.
Fifteen out of fifteen teachers rated it five stars, on the district's own survey.
The survey was anonymous and the district ran it, not us. Teachers had no reason to be generous and every opportunity not to be. Three of them wrote the following.
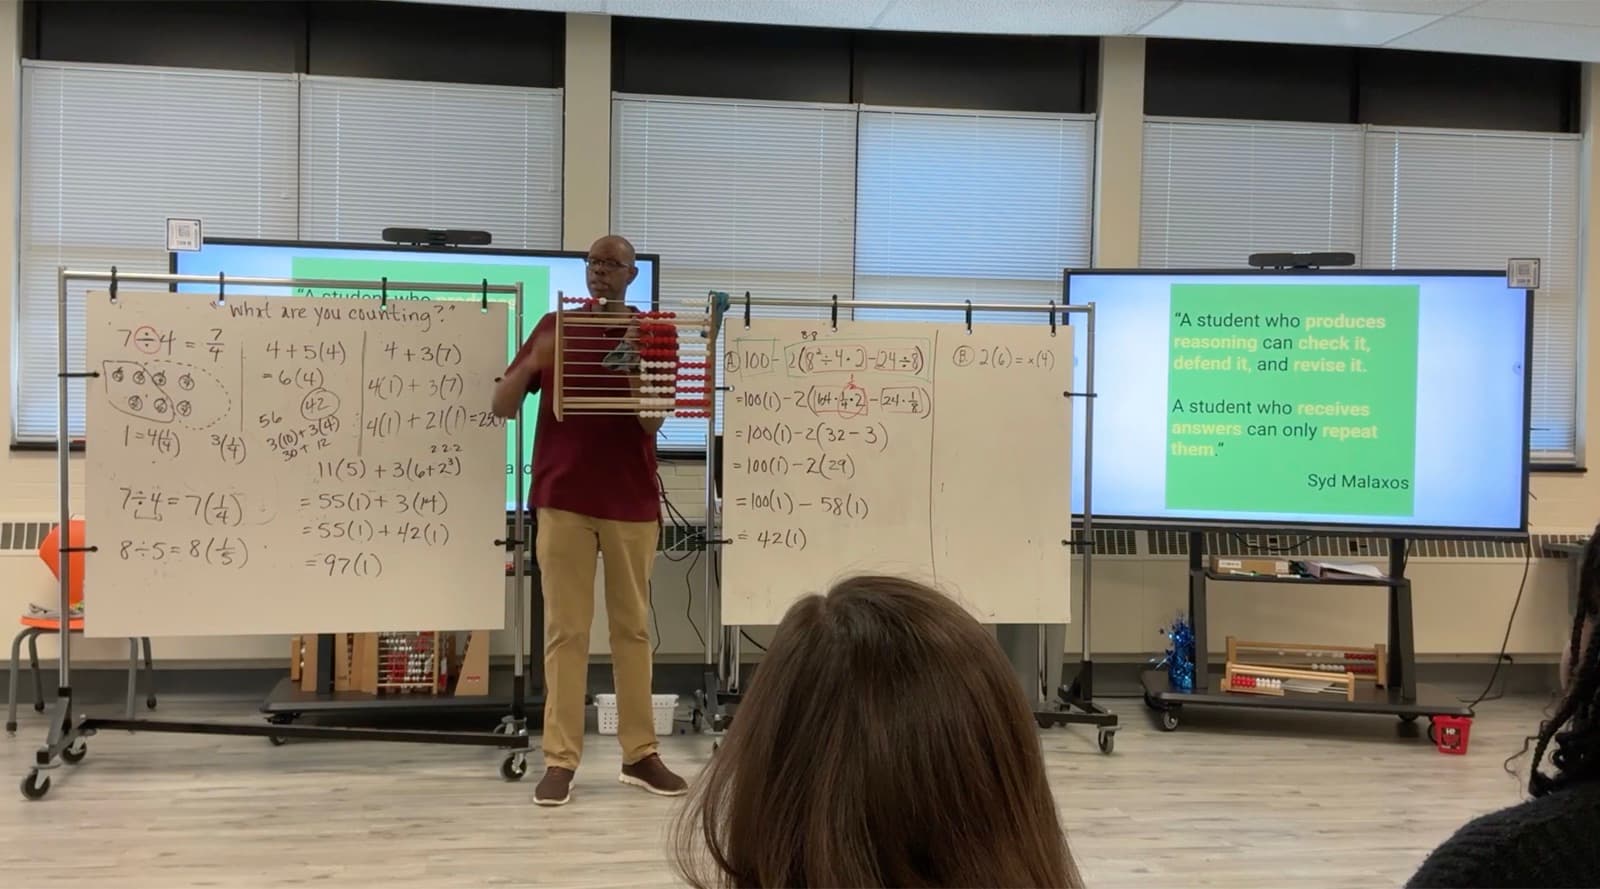
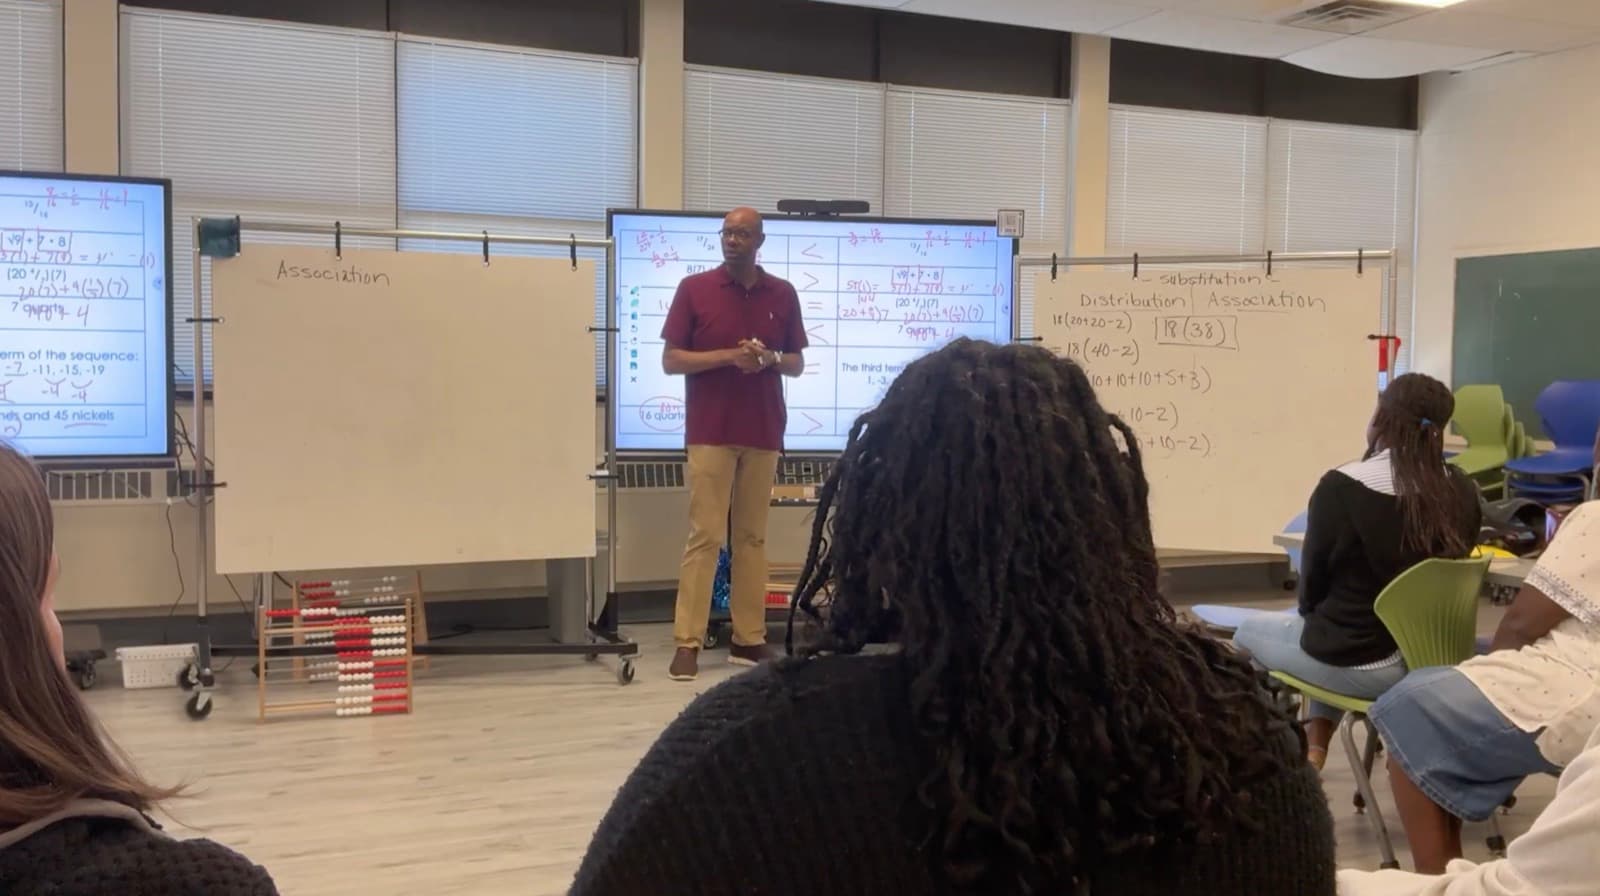
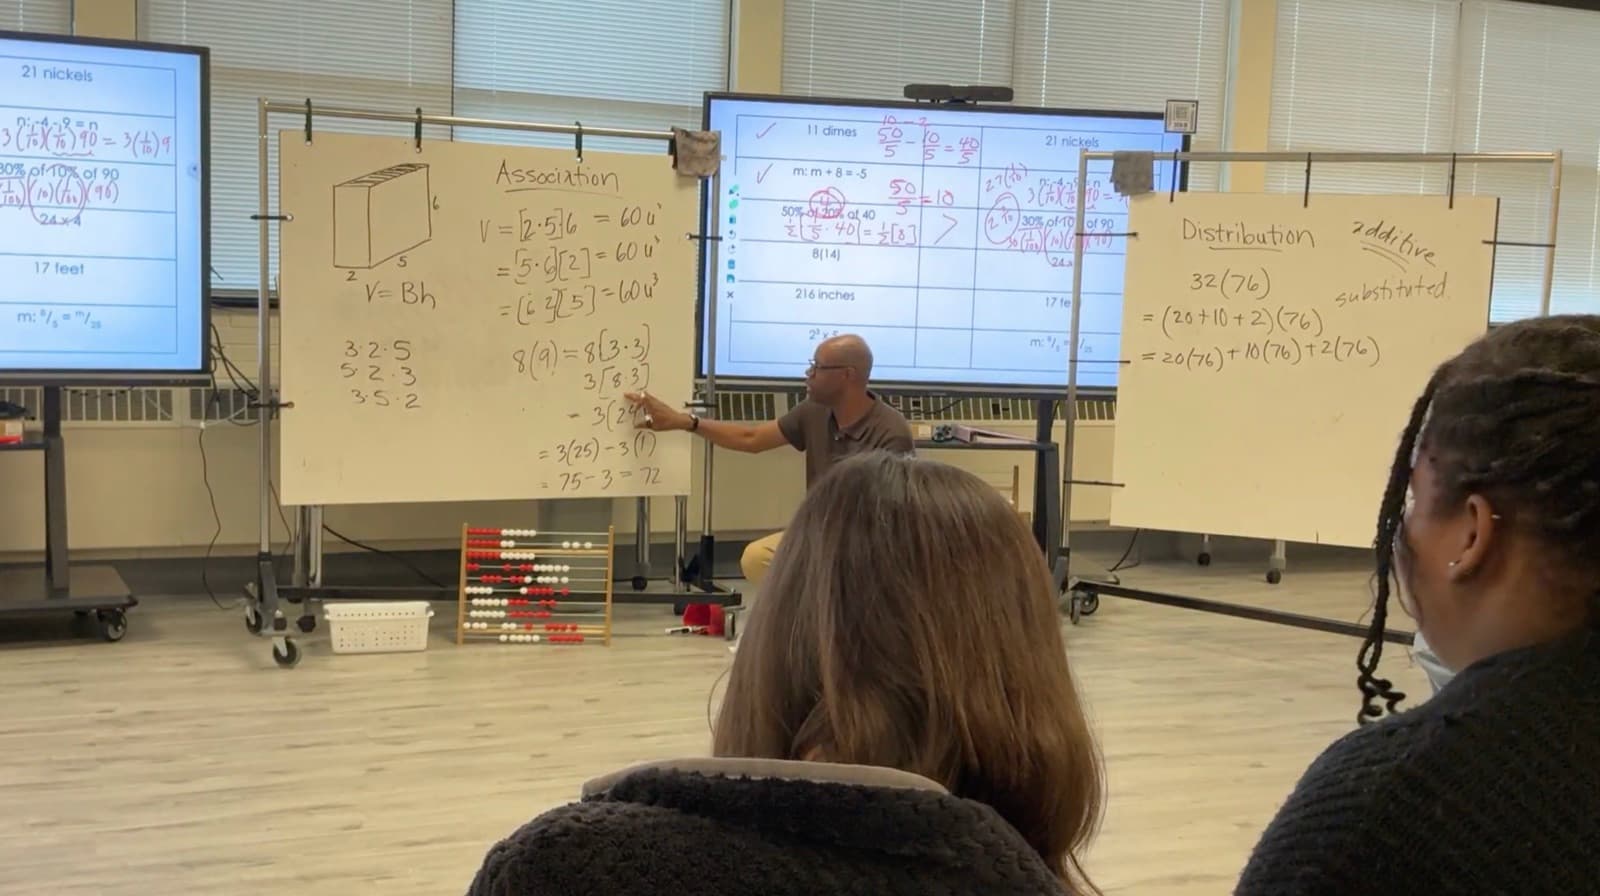
Challenged me to unlearn math so I could relearn it.
Got my staff into the work and language of math.
There is more than one way to do math. The process is more important than the answer.
Anonymous post-survey · administered by the district · Summer 2026 immersive
The fastest way to judge this is to do the mathematics yourself.
A 45-minute conversation first · the half-day is priced at cost